Some nonlinear models show a stronger recorded fit.
The random forest has the highest retained R² in this tabular comparison: 0.2246. The forest/XGBoost average does not exceed it.
 LAB / RESEARCH
AGILITYAI LAB
Our AI lab explores how data and machine learning can help us understand complex systems. We start with the relationship between historical weather and commercial real estate.
Explore the working paper01 / THE QUESTION
Can historical temperature extremes and precipitation add useful information when modeling commercial real estate returns?
The experimental archive brings together metropolitan financial records, weather observations and selected economic variables. It explores linear models, tree ensembles and recurrent neural networks.
Our working report reviews that implementation, records its retained results and sets out what a stronger evaluation must establish. It does not claim that weather causes a particular return or that the models forecast climate itself.
THE EXPANDED RESEARCH PANEL
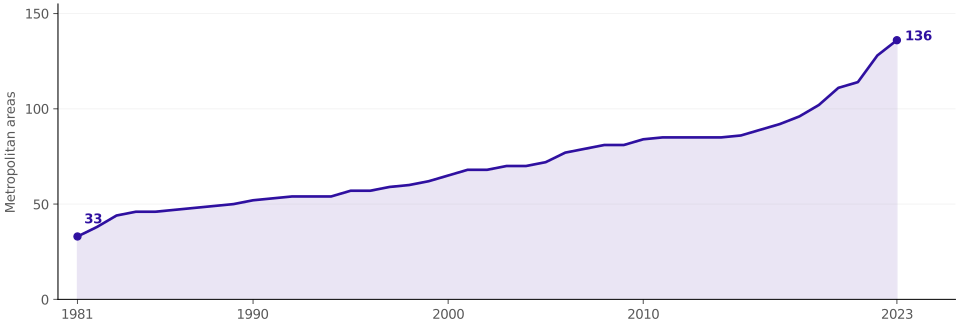
Counts describe the inspected, filtered archive. Coverage varies over time. They do not represent deployment, customers or validated performance across all markets. CBSA: Core-Based Statistical Area.
02 / THE MODEL WORKFLOW
Annual weather extracts → metropolitan matching → quarterly exposure fields → financial joins → tabular and recurrent experiments.
The supplied AgilityAI Real Estate Analytics Technical Exhibit informs this review alongside the model archive. It documents a reusable CBSA-quarter workflow and distinct experimental branches, rather than a verified production service.
Heat and cold indicators use thresholds of 30 and 0 respectively. Day-count interpretation requires confirmed Celsius units and complete records. Four-row and 24-row rolling fields need calendar checks before being described as quarterly histories.
The saved weather-feature network takes 12 rows × 11 features, passes through GRU layers with 70 and 35 units, then dropout 0.3 and a single Dense output. Its pooled rows are not necessarily consecutive quarters within one market.
03 / RECORDED RESULTS
This comparison belongs to the earlier five-market tabular experiments. It is separate from the expanded 136-market panel above. Values are retained notebook outputs; no training was rerun for this report.
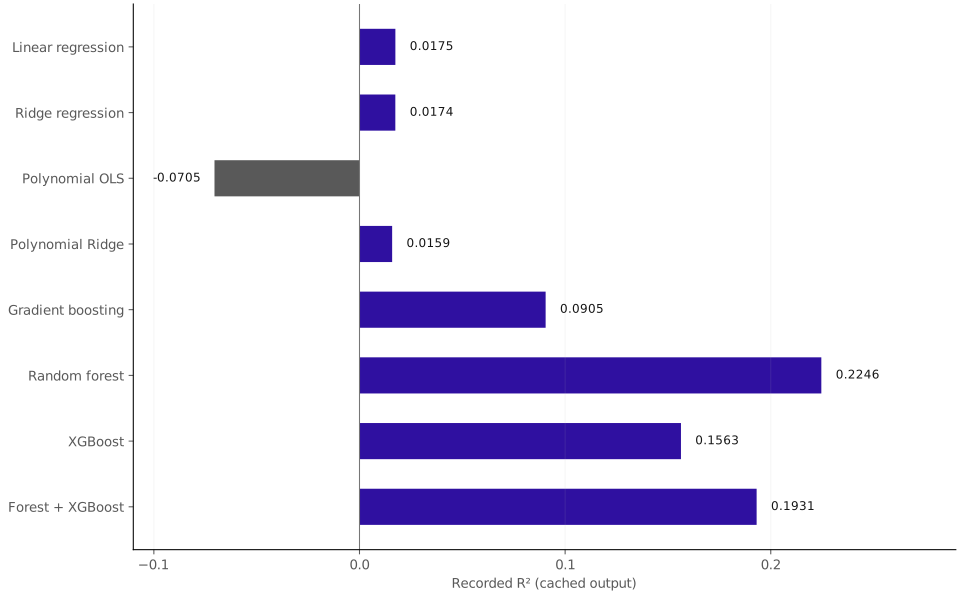
The random forest has the highest retained R² in this tabular comparison: 0.2246. The forest/XGBoost average does not exceed it.
Other regression branches retain same-period income and capital returns while predicting total return. Near-perfect scores there can reconstruct an accounting relationship.
Comparable holdouts and climate-feature ablations are required. These archived experiments do not establish an independently validated forecasting advantage.
| Model variant | MSE | R² |
|---|---|---|
| Linear regression | 0.0016450983 | 0.017450 |
| Ridge regression | 0.0016451395 | 0.017426 |
| Polynomial OLS | 0.0017923775 | -0.070514 |
| Polynomial Ridge | 0.0016477323 | 0.015877 |
| Gradient boosting | 0.0015227619 | 0.090517 |
| Random forest | 0.0012982849 | 0.224588 |
| XGBoost | 0.0014125745 | 0.156327 |
| Forest + XGBoost | 0.0013509678 | 0.193122 |
MSE is measured in squared target units. Different source tables, targets and preprocessing must not be combined into one leaderboard.
| Experiment | Input rows × fields | Cached MSE |
|---|---|---|
| Weather-feature GRU | 12×11 | 0.00029784 |
| Five-feature GRU | 12×5 | 0.00025447 |
The weather-feature branch evaluates an unscaled tret-mean target. The five-feature branch excludes weather predictors. Different experimental conditions prevent treating these two errors as a controlled climate-feature comparison or ranking them against the tabular results.
Recurrent targets average subsequent rows; they are not compounded holding-period returns. The dollar-named branch reports scaled-target error, not currency loss. The report also covers date decoding, shared archive filenames and final-holdout independence.
04 / WHAT COMES NEXT
The next validation protocol is proposed work, not a completed result.
05 / THE WORKING PAPER
Technical review · v0.2 · not peer reviewedAn exploratory modeling study and validation roadmap
A new English technical report covering the research question, data pipeline, model families, recorded results and evaluation limits. Prepared on October 28, 2026. Version 0.2 incorporates the supplied technical exhibit’s workflow, recurrent architecture and target-definition analysis.
Provider references explain the source families named in the archive; they do not certify this particular research dataset or its licensing.
The supplied AgilityAI Real Estate Analytics Technical Exhibit is a supporting source for the workflow, model specifications and evaluation limits (technical sections 2–12). Its original PDF is not distributed here; the new working report summarizes the relevant technical material.
PRISM Climate Group · historical climate data ↗NCREIF · Property Index methodology ↗Cvijanovic & van de Minne · Temperature Extremes and Commercial Real Estate ↗The related paper is by its named external authors. It is linked for context and is not an AgilityAI publication.